5 parts of IT Svit logging and monitoring toolkit
-
6679
-
0
-
22
-
0
Monitoring the infrastructure, apps and services, as well as logging the events for later analysis accounts for nearly half the effort of DevOps workflow. These 5 tools fit best for that purpose.
We are using both SaaS and self-hosted open source solutions, as proprietary software is often unable to satisfy our needs of precise configuration and ground-level integration with other tools we use. We also list the data collectors and exporters mostly, but using their respective databases for storing the data collected goes without question.
Thus said, we list 5 parts of IT Svit logging and monitoring toolkit in no particular order:
-
- FluentD
- Datadog
- Sumo Logic
- Prometheus & Grafana
- Elastic Stack (the former ELK)
We will briefly go through their pros and cons from our point of view, yet all of these tools are equally important for our daily operations.
FluentD — a universal data collector
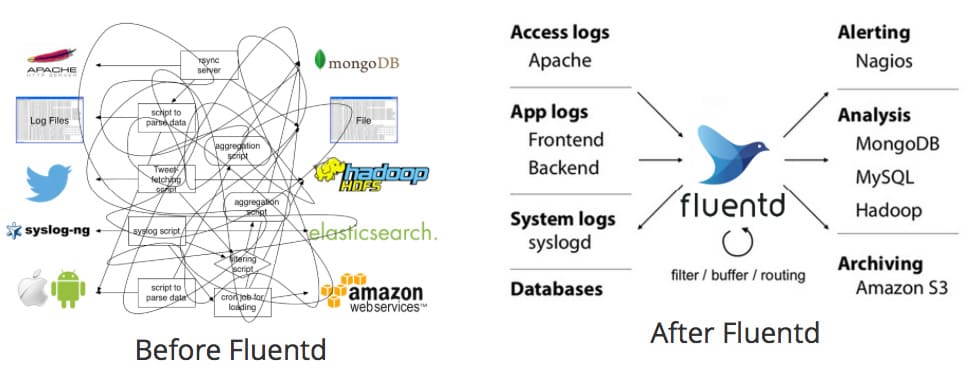
FluentD is an open source performance-optimized project, delivering a JSON transformation to provide a unified logging experience for any underlying platform, providing all the stages of data processing (collection, filtering, buffering) and outputting the data to any destinations.
FluentD pros are as follows:
- Distributed under Apache 2.0 Licence
- Flexible framework with more than 300 community plugins
- Lightweight solution with really low resource consumption
- Proven reliability, resilience and performance (able to monitor more than 5,000 servers at a time, processing 50,000 messages per second during peak workloads)
- Adjustable data output supporting multiple systems
FluentD has but a few cons:
- Does not work under Windows
- Has no visualization features out-of-the-box (yet multiple plugins help solve this task)
Datadog — a pool for storing all your logs and metrics
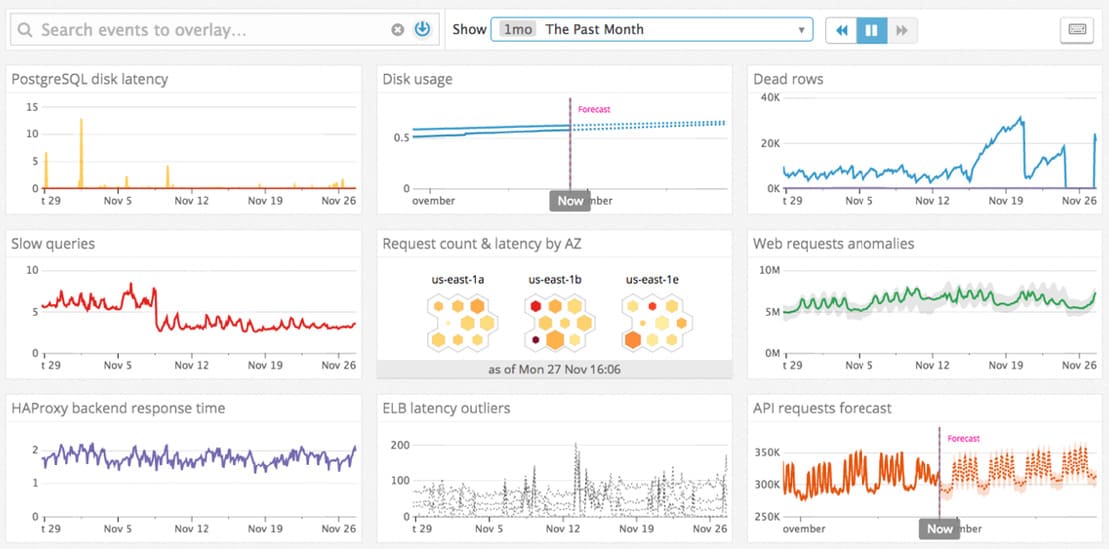
Datadog is a SaaS platform that helps bring the metrics from databases, servers, services, and tools to form a unified view of the whole stack. All of the metrics, events, and alerts are available in a highly collaborative environment to ease the monitoring and operations for DevOps engineers.
Datadog boasts the following pros:
- Robust and productive API with in-depth documentation
- Ease of installation and configuration
- Heroic customer support
- Intuitive and efficient user interface
- Broad range of integrations available
- Graphs and metrics can be created on the fly with ease
There is but one Datadog con, and it is a somewhat bulky process of integration with AWS, though it is a minor issue, nothing a skilled DevOps engineer can’t overcome.
Sumo Logic — blazing-fast logs processing
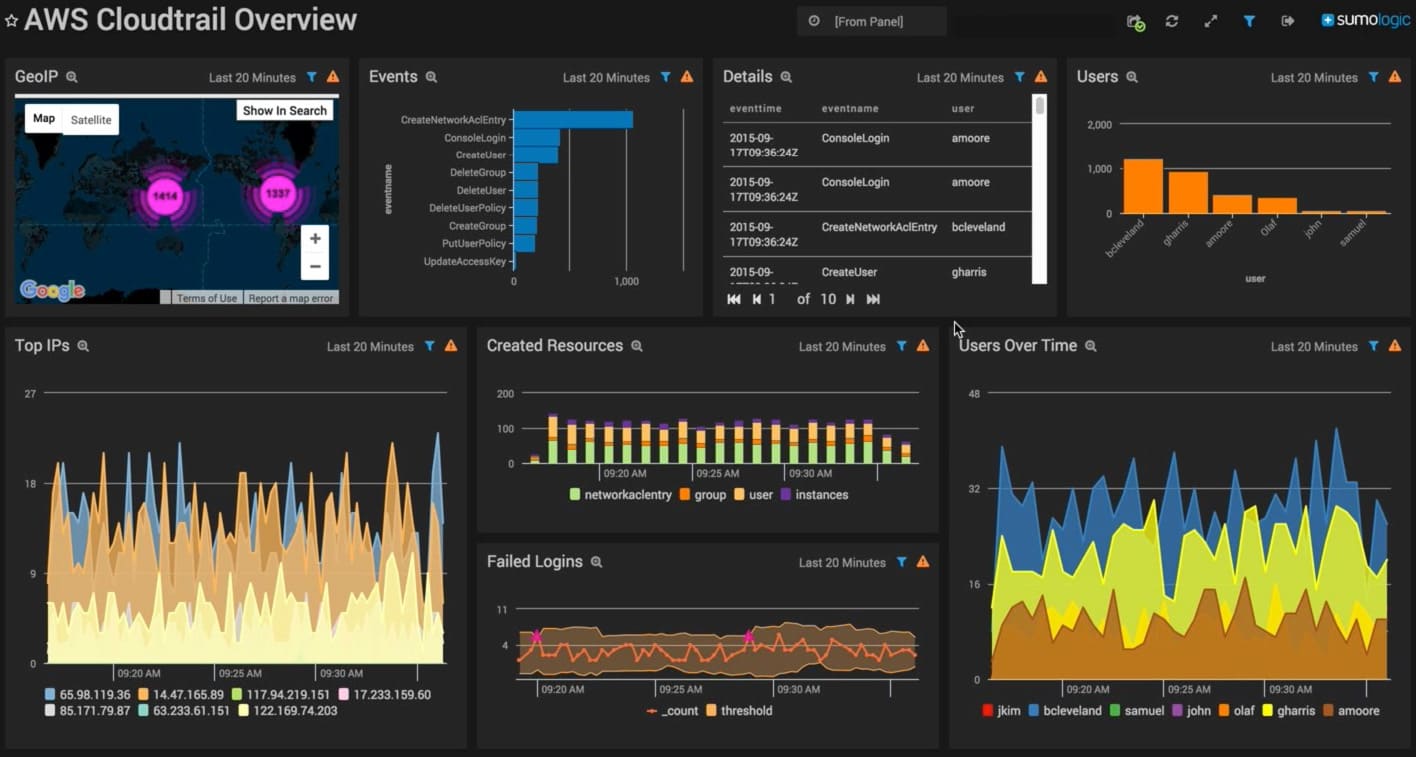
Sumo Logic is a cloud-based SaaS for logging, management and real-time analytics of machine-generated Big Data. Leveraging the LogReduce and Elastic Log processing technologies, Sumo Logic is a service that works equally well with gigabytes or petabytes of data.
Sumo Logic pros:
- Great for working with standardized logs
- Lightning-fast processing of the data regardless of the size
- Performance-optimized dashboard with many convenient features
Sumo Logic cons:
- As Sumo Logic is SaaS, there are not a lot of integrations available, so developing custom ones should be required
- Plugins are needed to work with certain data types
Prometheus — the one-stop shop for monitoring
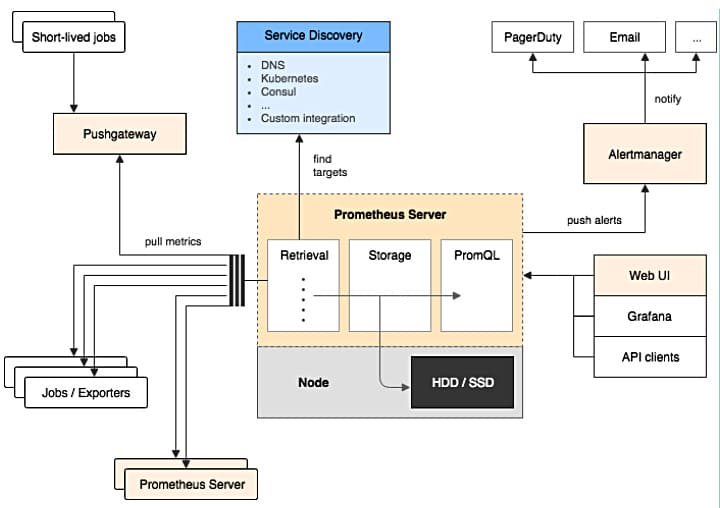
Prometheus is a platform for monitoring and alerting originally developed by SoundCloud and now being an open source project from The Linux Foundation. Able of multi-dimensional data monitoring and collecting, working well both with microservices and machine-centric architectures, the Prometheus Exporter is the tool of choice when it comes to processing multiple data streams at once.
Prometheus pros:
- Multidimensional data model and a flexible query language for using it
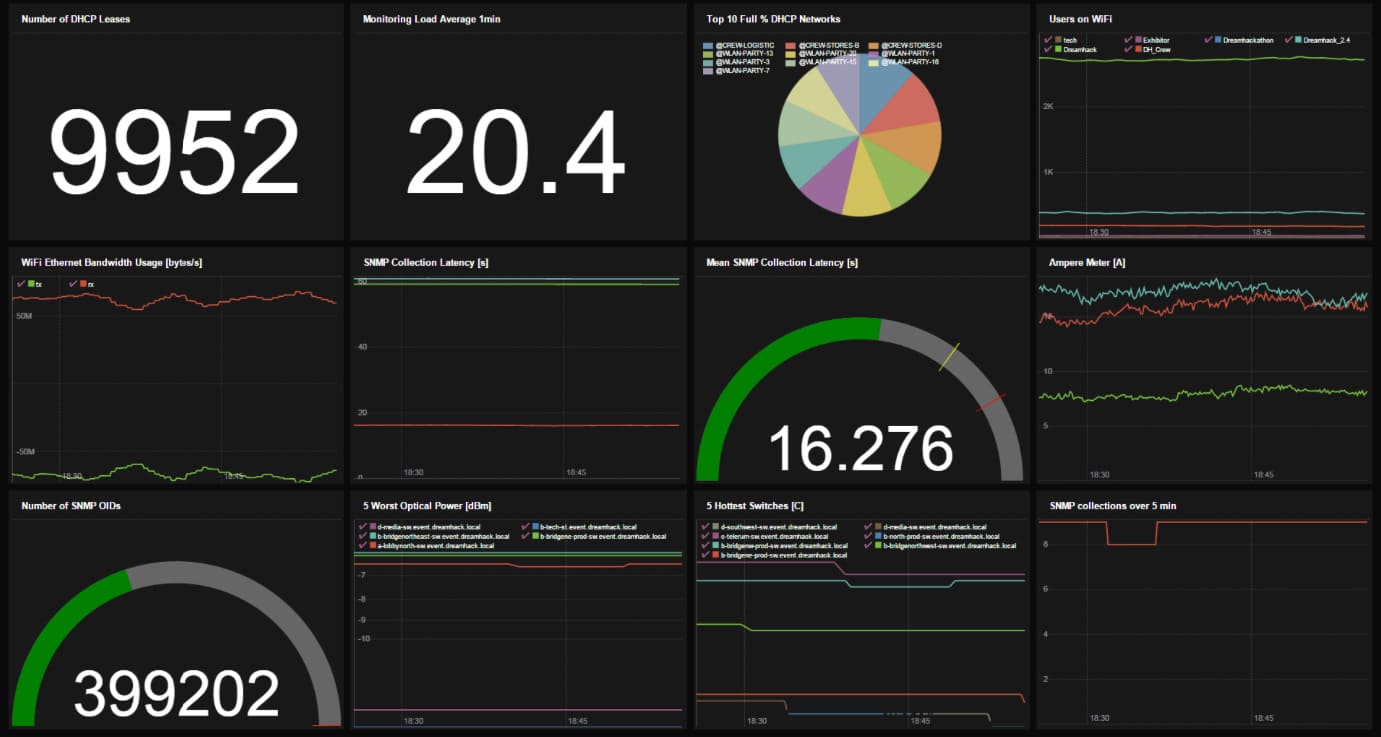
- Intuitive dashboards for displaying the data
- Autonomous server nodes to boost fault tolerance
- Pull model for scheduled data collection over HTTP
- Push model for short-term data collection over an interim gateway
- You can configure the Prometheus endpoints yourself or use an auto-discovery service
- Various modes of data output and alerting
Prometheus cons:
- Not ideal for logs processing
- No long-term data storage
- No anomaly detection
- Manual horizontal scaling and user management
- Grafana is required to deliver the best results with visualization
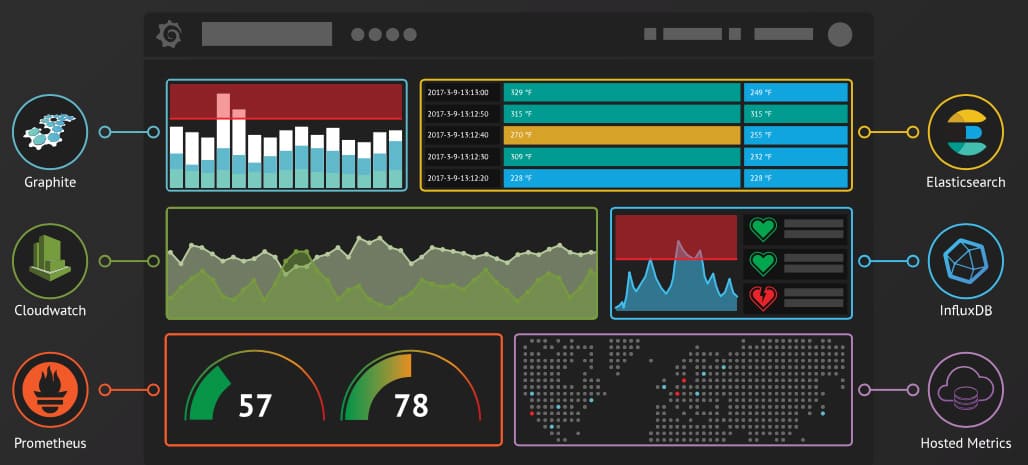
Grafana is an excellent addition to Prometheus, allowing to visualize the logs and metrics to deliver more intuitive and visible results. Using Grafana allows consuming the crucial details on the go, turning the logs into clearly understandable graphs.
Elastic Stack — the most popular log and event processing tool
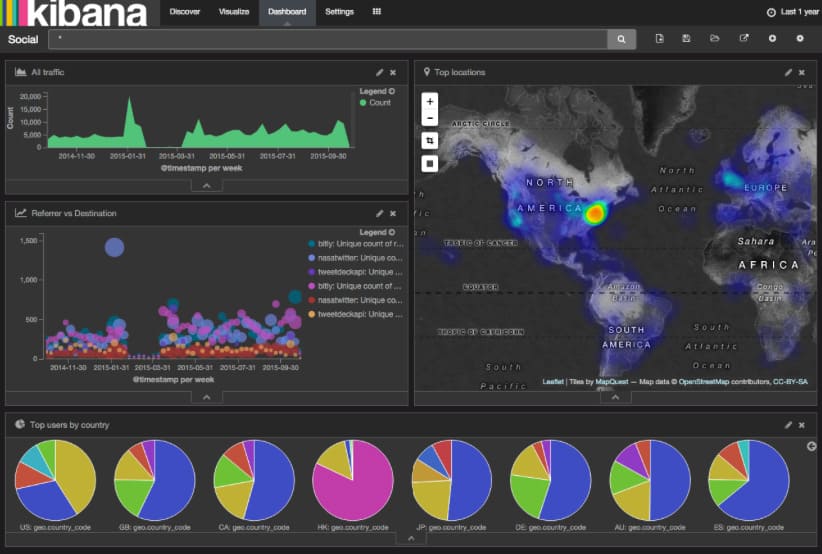
ElasticSearch, Logstash and Kibana are the tools of the trade for innumerable IT professionals worldwide. ElasticSearch is a great search engine to sift through the logs, Kibana is a great visualization tool and Logstash helps process the logs and other events from various servers, systems and networks in the cloud to optimize the management and deliver them to a centralized storage and analytics system. Elastic Stack can be used for free or bought as a SaaS solution from Elastic.
Elastic Stack pros:
- Rapid query through logs
- Highly customizable
- Multiple integrations
Elastic Stack cons:
- Time-consuming installation with no one-click installer, as the suite consists of three components that should be intertwined.
- Complex configuration to ensure correct system performance
- No native support for Microsoft environments
Final thoughts on 5 parts of IT Svit logging and monitoring toolkit
We’ve listed 5 parts of IT Svit logging and monitoring toolkit including FluentD, Datadog, Sumo Logic, Prometheus & Grafana and Elastic Stack. We use these SaaS and open source products to ensure in-depth monitoring, detailed logging and timely alerting for multiple highly-loaded industry-leading projects in marketing, financial and analytical industries. We are also glad to share our experience, so if you have any questions regarding setup and configuration of these solutions — drop us a line, we are glad to help!
